Chapter 3: Potentially Plantable Spaces to Enhance Tree Cover
Data and Methods
The i-Tree Landscape tool (www.itreetools.org; i-Tree, 2017) was used to assess vegetation and impervious cover extents within the watershed to locate opportunities for enhanced tree cover. Raster data of tree cover, impervious cover, and land cover (LC) were used to quantify the amount and distribution of available space for trees, also called plantable space, in the watershed. These data were derived from the 2011 National Land Cover Database (NLCD), which used Landsat imagery to evaluate land cover at a 30m resolution (Homer et al., 2015). Tree and impervious cover were described as percentages of total area in each 30m pixel, while LC was evaluated as one of 16 discrete classes. Tree and impervious cover were calculated independently and do not represent mutually exclusive space within a pixel; e.g., a pixel with 40% tree cover and 70% impervious cover has at least 10% of its total area covered by both tree canopy and an impervious surface.
Tree and impervious cover data were used to calculate a plantable space value for each watershed pixel. Plantable space for a given pixel i (PSi, %) was defined as
(Eq. 1)
where TCi is the percent tree cover in pixel i and ICi is the percent impervious cover in pixel i. Pixels with the NLCD land cover class of 11 (open water) were designated not plantable and automatically given a plantable space of 0% instead of calculating plantable space with Equation 1.
Excluding open water, the Portage Creek watershed consisted of 14 NLCD land cover classes (Figure 3.1):
Developed Land:
~ 21: open developed land with <20% impervious cover
~ 22: low-intensity developed land with between 21% and 49% impervious cover
~ 23: medium-intensity developed land with between 50% and 79% impervious cover
~ 24: high-intensity developed land with >79% impervious cover
Barren Rock/Sand/Clay:
~ 31: barren land with <15% total vegetation (tree, shrub, or herbaceous) cover
Forests:
~ 41: deciduous forest with trees representing >20% of total vegetation cover
~ 42: evergreen forest with trees representing >20% of total vegetation cover
~ 43: mixed (deciduous and evergreen) forest with trees representing >20% of total vegetation cover
Shrubland:
~ 52: shrubland with shrubs representing >20% of total vegetation cover
Herbaceous:
~ 71: grassland with herbaceous vegetation representing >80% of total vegetation cover
Planted/Cultivated:
~ 81: cultivated pasture with herbaceous pasture/hay representing >20% of total vegetation cover
~ 82: cultivated cropland with crop vegetation representing >20% of total vegetation cover
Wetlands:
~ 90: woody wetlands where tree or shrub cover accounts for >20% of total vegetation cover
~ 95: herbaceous wetlands where herbaceous vegetation accounts for >80% of total vegetation cover
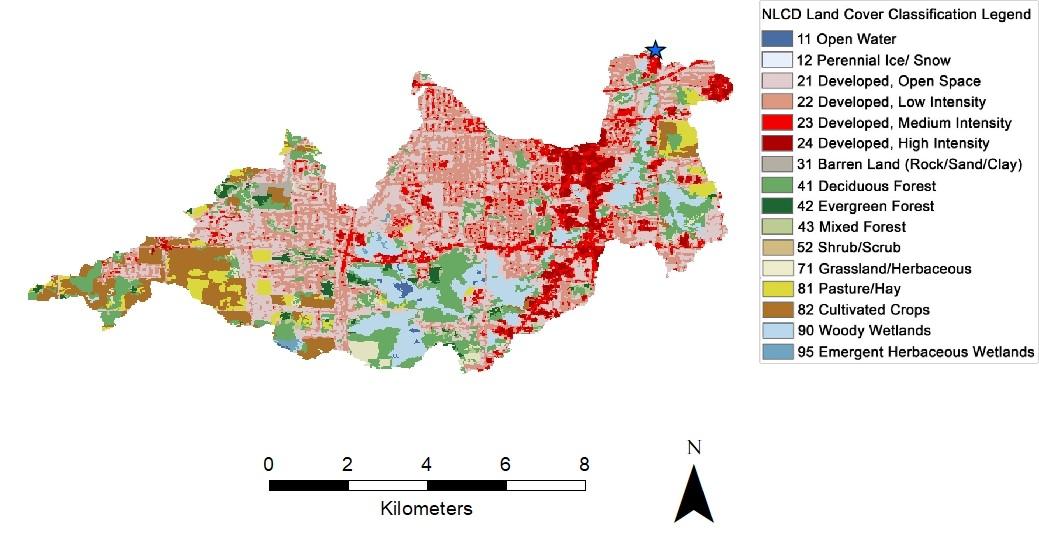
Figure 3.1. Land cover in the Portage Creek watershed. Blue star indicates the watershed drainage point.
Each non-water land cover class in the watershed was evaluated for:
a) total plantable space in the land cover class (km2)
b) percent of plantable space within the land cover class
c) plantable space in the land cover class as a percent of total watershed plantable space
To help address the variablility of plantable space within land cover classes, the standard deviation of plantable space was calculated. Plantable locations were also mapped to illustrate variation and locations with the watershed that could potentially be planted.
Results
Overall, 52% (26 km2) of the Portage Creek watershed was classified as plantable space with a standard deviation of 29% (Figure 3.2). Developed land cover classes (NLCD code(s) 21, 22, 23, 24) accounted for the majority of total plantable space (60%, or 16 km2) while accounting for 62% (31 km2) of the watershed area. The land cover class with the most plantable space was open developed land, containing 28% (7 km2) of total watershed plantable space. The land cover class with the most plantable space as a percentage of its total land area was cultivated cropland (92% plantable) (Figure 3.3).
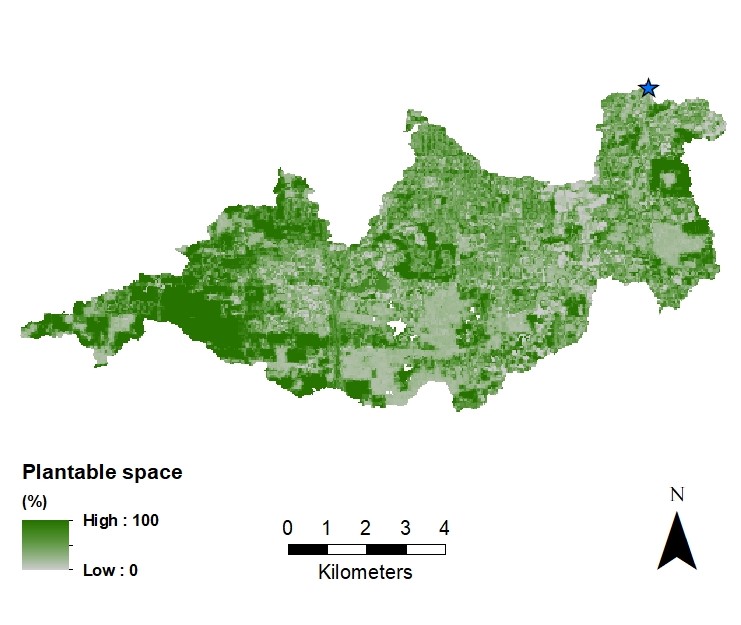
Figure 3.2. Spatial distribution of plantable space in the Portage Creek watershed. Blue star indicates the watershed drainage point.
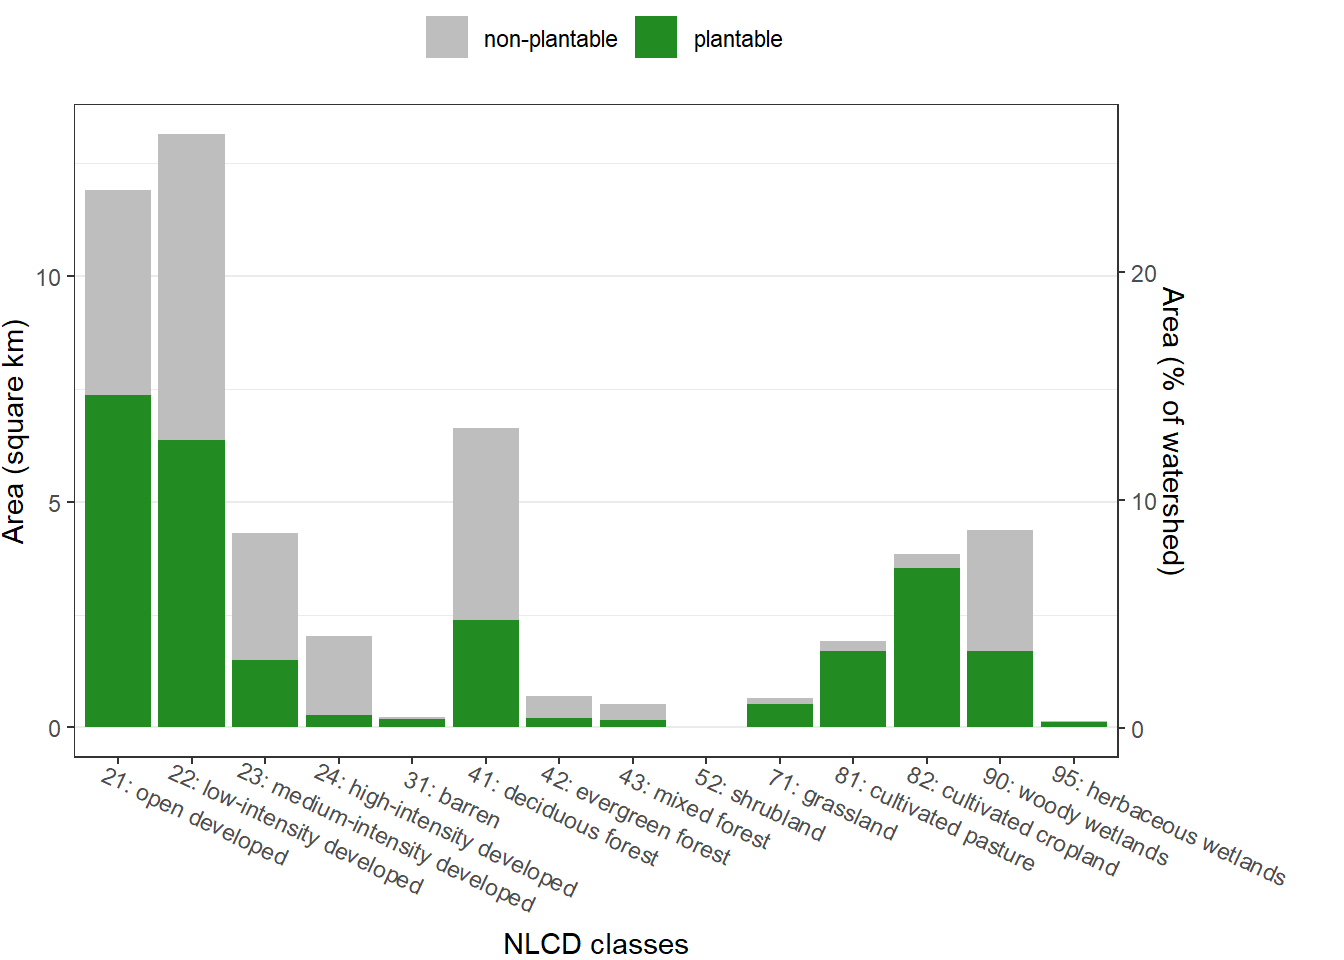
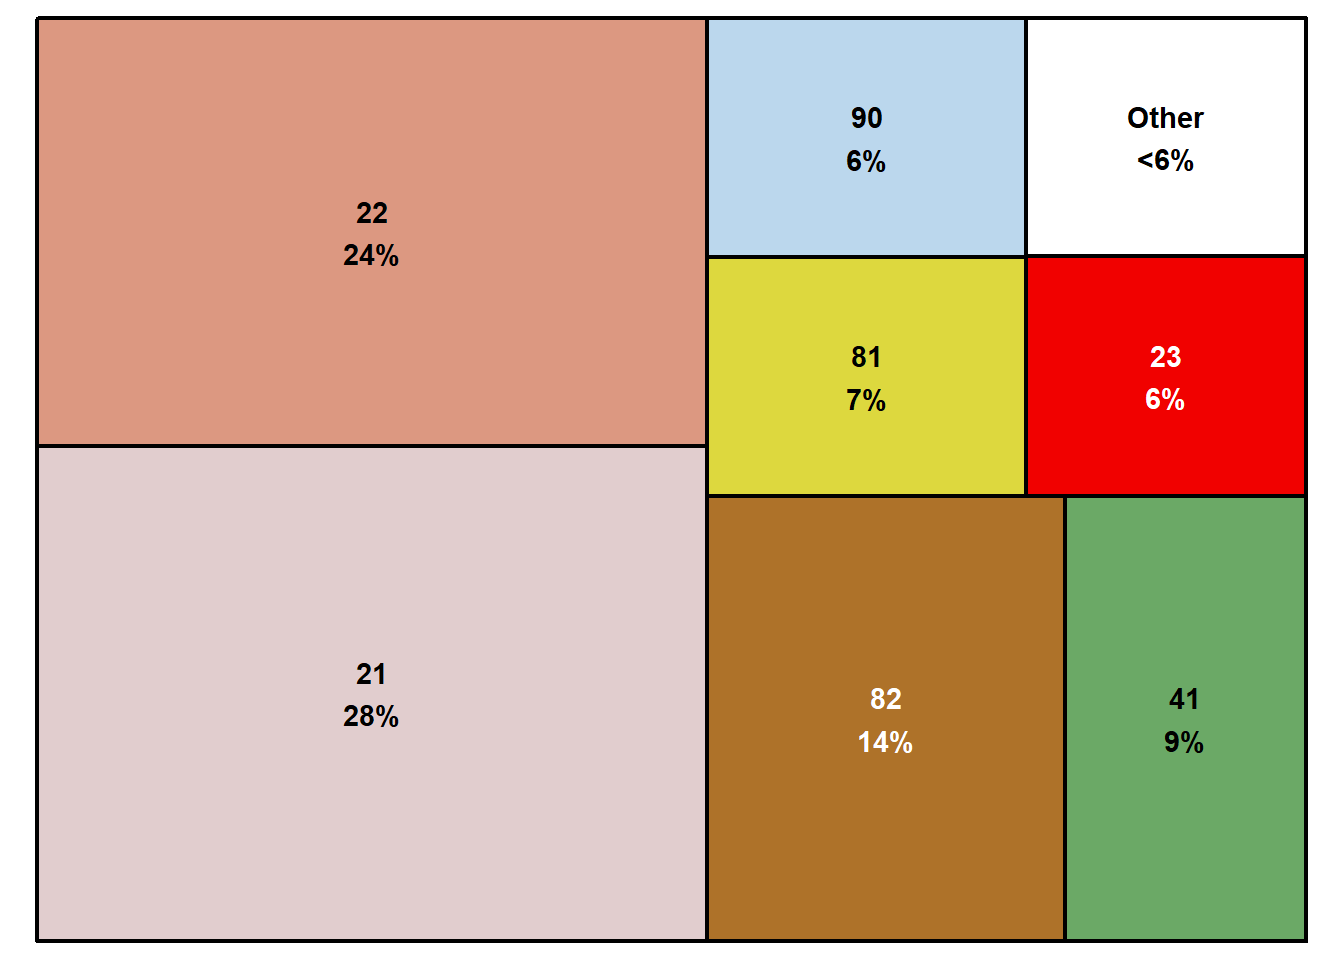
Figure 3.3. Plantable space (PS) information for each non-water land cover class in the watershed: (top) total area and PS, in km2 and as percent of total watershed space; (bottom) distribution of PS between land covers.
Discussion
Tree cover and impervious cover are not mutually exclusive and it cannot be determined how much the two cover types overlap in any pixel, so the plantable space values calculated here represent a minimum estimate of plantable space not covered by either canopy or impervious surfaces. This overlap will lead to underestimates of plantable space, and it is recommended that finer-scale assessments of possible planting locations be supplemented with detailed orthoimagery and/or field survey data. The NLCD has been found to underestimate tree cover by an average of 9.7% (Nowak and Greenfield 2010), which would contribute to an overestimate of plantable space.
Although these non-tree and non-impervious areas are potentially plantable, they may not actually be plantable due to land use restrictions. For example, open developed land may be active recreational areas that are unsuitable for trees. Agricultural or barren lands may also be unsuitable for trees due to social, environmental, and economic factors not considered here. Agroforestry and other integrative approaches to land management can enable more plantable space in marginal lands. Conversely, some areas considered ‘unplantable’ in this analysis could accommodate trees and provide significant benefits, as with street tree planters, but these areas are not considered here due to the relatively high cost of planting in impervious areas relative to pervious ground. Verification of plantable space identified in this analysis can be done through site visits or by analyzing recent aerial images via i-Tree Landscape or other programs with recent aerial images (e.g., Google Earth, Google Maps).
On their own, maps of plantable space describe where increasing tree canopy is possible. Comparing plantable space data with datasets of other valuable watershed characteristics can help determine where increasing tree canopy could be most effective or useful. The dataset(s) used for comparison will depend on the priorities of each management plan. For example, detailed watershed locations where trees reduce runoff and nutrient loading are given in the i-Tree Buffer analysis (Chapter 2). The maps of plantable space, NLCD cover, and nutrient loading (along with other datasets) can be downloaded at the GLRI Forest Planning project webpage for further visualization and analysis. Landscape managers working with these numerous datasets can develop specific long-term management plans to enhance and sustain healthy trees and forests within the watershed to improve environmental quality and human health.