Executive Summary
The impact of urban forests and land cover on storm water runoff were assessed for the Plum Brook watershed in Utica, MI (Figure ES.1) using various i-Tree models. The results from these assessments can aid managers in:
- Quantifying the impacts of land cover on runoff and water quality
- Selecting the best locations for trees to reduce nutrient pollution into streams
- Selecting the best tree species for reducing storm water runoff
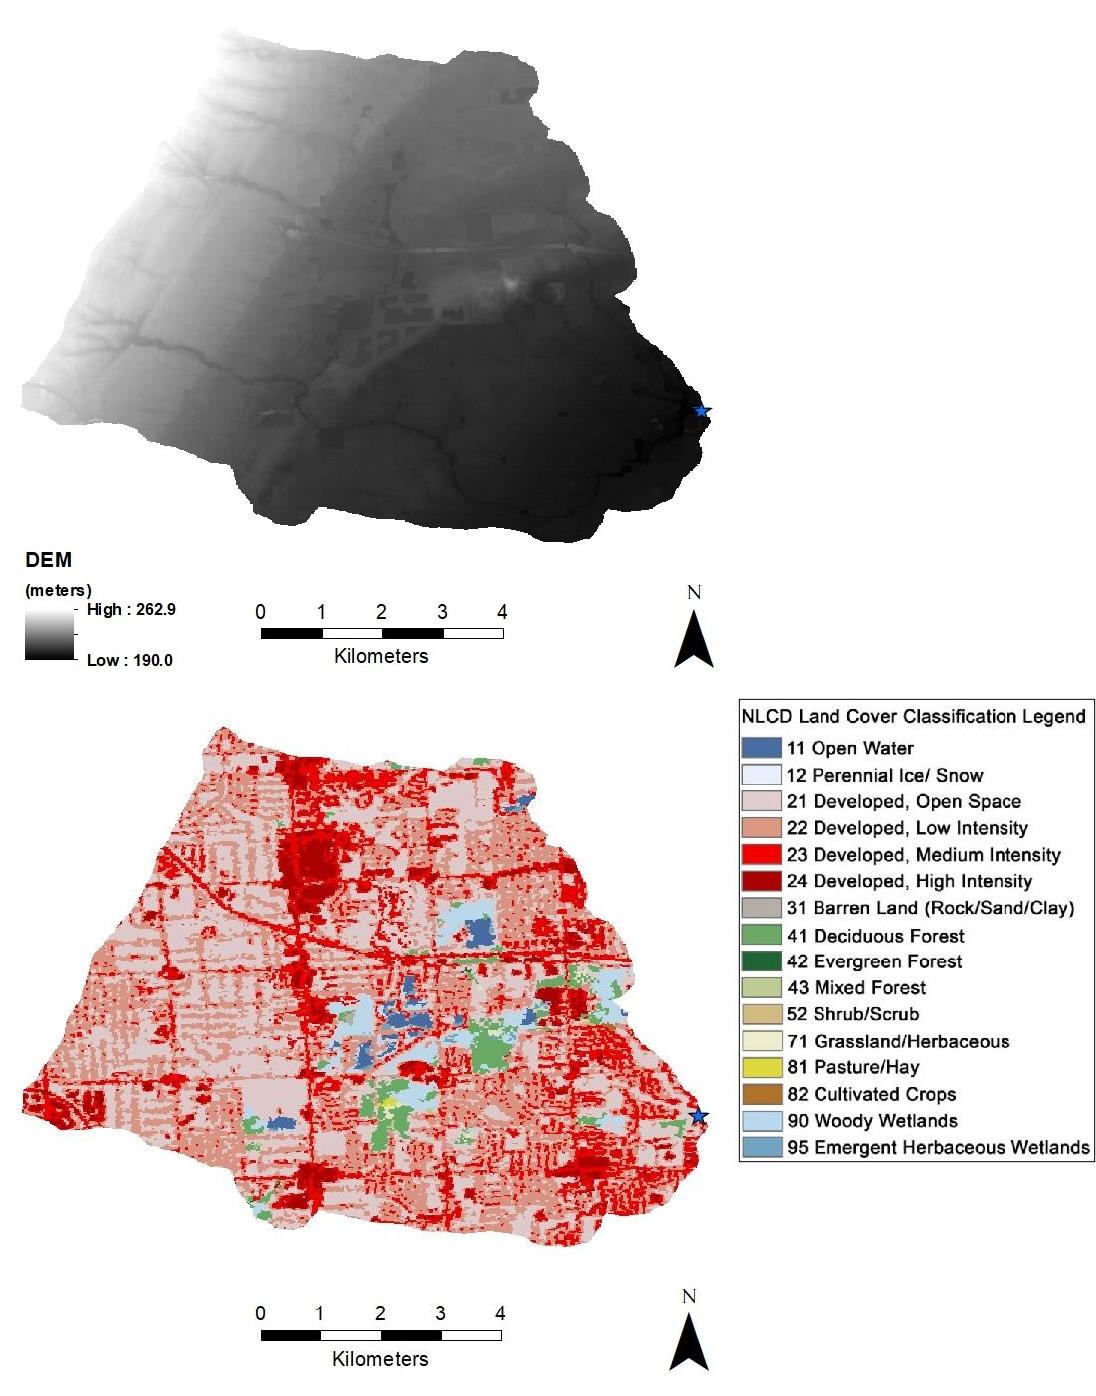
Figure ES.1. Maps of elevation (top) and land cover (bottom) in the Plum Brook watershed. Blue stars indicate the watershed drainage point.
For more detailed discussions of methods and results, see the full chapters of the report.
Chapter 1: Land Cover Impacts on Storm Water Runoff and Water Quality
Methods
The i-Tree Hydro model simulated surface runoff, stream flow, and water quality for different amounts of tree and impervious cover in the Plum Brook watershed. A scenario with the current level of tree cover was compared to a “no-tree” scenario so the benefits of the current tree cover could be quantified.
Results
Loss of current tree cover (33.82%) in the watershed increased runoff by an average of 2% or 18 million m3. Removal of current impervious cover (34.55%) reduced runoff by an average of 43.1% or 393 million m3. With the watershed’s current land cover, increasing impervious cover had a 29 times greater impact on runoff relative to tree cover.
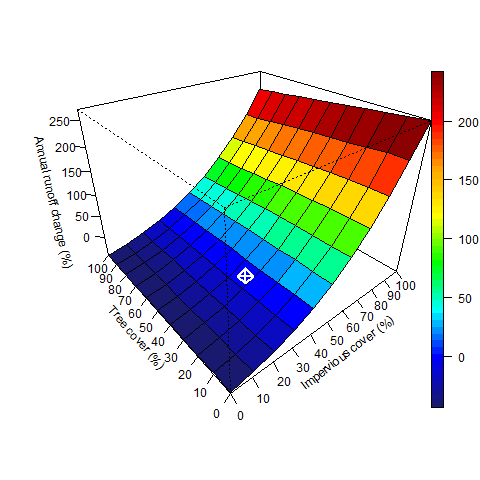
Figure ES.2. Percent change in annual runoff during simulation period based on changes in percent impervious and percent tree cover. White square represents current conditions.
Based on these changes in runoff rates, the current tree cover is estimated to reduce water pollution during the simulation period by the amounts listed in Table ES.1. These are all major pollutants associated with urban runoff and potentially harmful to receiving waters (Horner et al., 1994).
| Total Suspended Solids | Biochemical Oxygen Demand | Chemical Oxygen Demand | Total Phosphorus | Total Nitrogen | Copper | |
|---|---|---|---|---|---|---|
| Median | 13.301 | 2.127 | 8.268 | 0.044 | 1.166 | 0.002 |
In the scenario based on current land cover, trees intercepted about 3.7% (1.5 million m3) of total precipitation in this watershed during the year. Stream flow was composed of baseflow (45.8%), runoff from pervious areas (40.4%), and runoff from impervious areas (13.8%).
Recommendations
Increasing tree cover will reduce runoff, but the dominant cover type controlling runoff is impervious surfaces. Removing impervious surfaces or retaining runoff from impervious surfaces to increase the infiltration of storm water into soils has the greatest impact on reducing runoff.
If impervious surfaces cannot be removed from the watershed, adding tree cover to impervious land reduces runoff more effectively than adding tree cover to pervious land (see Figure 1.5), so efforts to increase tree cover over impervious lands will maximize tree effects on runoff. If impervious cover can be removed and replaced, replacing with pervious cover in general and pervious with trees in particular would maximize landscape effects on reducing runoff.
Trees can be included in these efforts to increase storm water retention while providing numerous co-benefits. Tree canopy can intercept rainfall and tree roots can help create space in soils for infiltration. These functions have relatively large effects in small rainstorm events, where up to 100% of the rainfall can be intercepted or infiltrate into the soil beneath trees. However, trees have limits to the amount of rainfall they can intercept at once, with most trees carrying at maximum somewhere between 0.07 and 0.6 mm of water depth on their leaves (van Dijk, 2010; Wallace et al., 2013). After that capacity is reached, the additional rainfall moves through the tree crown to the ground. Maximizing leaf area with larger trees would maximize the reduction in storm water runoff. If the rate of the water reaching ground exceeds the soil infiltration rate, runoff is created. This is why in larger storms, more of the rain can become runoff while trees have a relatively smaller effect. Interception of precipitation by trees also lengthens the time it takes storm water to travel to the stream outlet, producing a flatter flood hydrograph with lower peak and average stream flow. The shade produced by trees also moderates stream and near-surface air temperatures, while providing other co-benefits to human health.
Chapter 2: Priority Locations to Reduce Nutrient Loading
Methods
The i-Tree Buffer tool generated maps of nonpoint source (NPS) pollution of nutrients (total phosphorus and total nitrogen). These maps identify locations or “hotspots” where pollutant loading is high, the amounts of runoff generated upslope of the hotspot are high, and the potential for pollution filtering or “buffering” downslope of the hotspot are low. Pollutant loading is measured in terms of a dynamic export coefficient (ECd) which describes the kilograms (kg) of a pollutant exported per hectare (ha) of land area per year (yr).
Results
Within the watershed, the median phosphorus loading value was 0.83 kg/ha/yr (+/- 0.4 kg/ha/yr) and the median nitrogen loading value was 23.3 kg/ha/yr (+/- 14.95 kg/ha/yr). The top 5 watershed hotspots for phosphorus and nitrogen are shown in Figure ES.3 and Table ES.2 below.
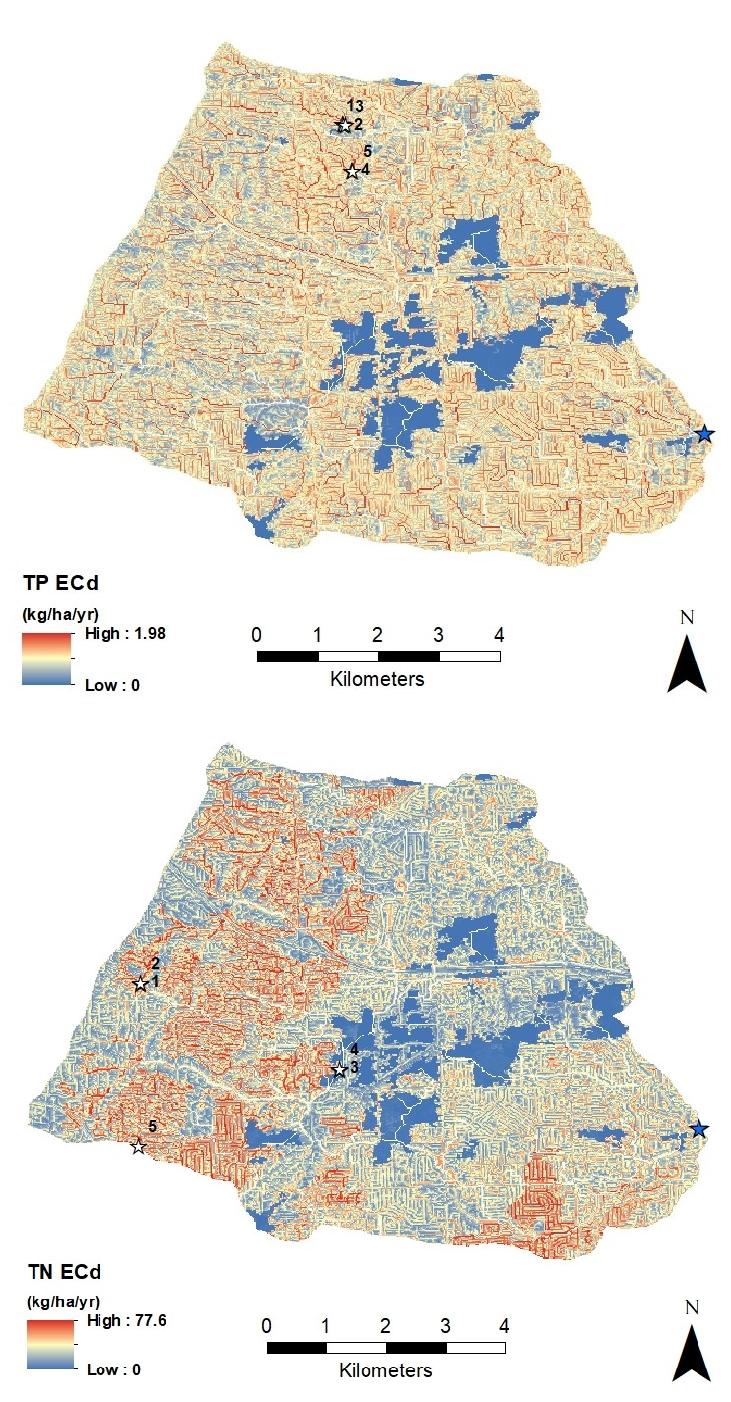
Figure ES.3. Distribution of dynamic export coefficients (ECd) for total phosphorus (top) and total nitrogen (bottom). White stars indicate the top five ECd values (see Table ES.2), labeled according to rank. Blue stars indicate the watershed drainage point.
Table ES.2. Top hotspots for pollutant loading in the Plum Brook watershed.
| Pollutant | Rank | ECd (kg/ha/yr) | Latitude, longitude (decimal minutes) |
|---|---|---|---|
| TP | 1 | 2.0 | 42 38.833’ N, 83 7.5’ W |
| 2 | 2.0 | 42 38.824’ N, 83 7.49’ W | |
| 3 | 2.0 | 42 38.824’ N, 83 7.48’ W | |
| 4 | 2.0 | 42 38.418’ N, 83 7.422’ W | |
| 5 | 2.0 | 42 38.418’ N, 83 7.413’ W | |
| TN | 1 | 77.6 | 42 37.384’ N, 83 9.326’ W |
| 2 | 75.6 | 42 37.394’ N, 83 9.326’ W | |
| 3 | 75.5 | 42 36.611’ N, 83 7.529’ W | |
| 4 | 73.8 | 42 36.621’ N, 83 7.529’ W | |
| 5 | 73.7 | 42 35.925’ N, 83 9.345’ W |
Recommendations
For each pollution hotspot, approaches to reduce ECd can be divided into three categories:
- Reducing pollutant loading at the hotspot. This reduction could involve altering land cover at the hotspot to land cover with lower pollutant loading values; or using best management practices for the current land use (for example, contour farming and covered fertilizer storage in an agricultural hotspot).
- Increasing buffering capacity in the downslope flow path of the hotspot. Buffering capacity (as defined in i-Tree Buffer) could be increased by including more herbaceous and woody vegetation in the downslope flow path, or by decreasing the slope of that flow path.
- Reducing the volume of runoff generated upslope of the hotspot. This reduction could be accomplished by removing impervious cover or decreasing local terrain slopes in the upslope area.
A management plan for a given hotspot could involve any combination of the above approaches. Ultimately, management needs to be tailored to each hotspot’s unique conditions for land cover and land use, topography, social conditions, and plantable space.
These management approaches could be further directed by taking plantable space into account. Nutrient hotspot locations can be compared with the local plantable space data from Chapter 3 to strategically target tree plantings that will minimize NPS pollution as well as expand tree canopy in low-canopy areas.
Only the top 5 hotspots are reported here as an example, but other hotspots exist. The hotspot map data (Figure ES.3) can be downloaded at the GLRI Forest Planning project webpage for further analysis of hotspots to aid in reducing NPS pollution throughout the watershed.
Chapter 3: Potentially Plantable Spaces to Enhance Tree Cover
Methods
Land cover data from i-Tree Landscape were used to identify available space for trees, also called plantable space, in the Plum Brook watershed. Plantable space was calculated as the percentage of land area not covered by trees, impervious surfaces, or water. This calculation was performed for each land cover classification in the National Land Cover Database (NLCD) (Homer et al., 2015) that was present in the watershed.
Results
The Plum Brook watershed consisted of the following NLCD land cover classes, excluding open water (Homer et al., 2015):
Developed Land:
~ 21: open developed land with <20% impervious cover
~ 22: low-intensity developed land with between 21% and 49% impervious cover
~ 23: medium-intensity developed land with between 50% and 79% impervious cover
~ 24: high-intensity developed land with >79% impervious cover
Barren Rock/Sand/Clay:
~ 31: barren land with <15% total vegetation (tree, shrub, or herbaceous) cover
Forests:
~ 41: deciduous forest with trees representing >20% of total vegetation cover
~ 42: evergreen forest with trees representing >20% of total vegetation cover
~ 43: mixed (deciduous and evergreen) forest with trees representing >20% of total vegetation cover
Shrubland:
~ 52: shrubland with shrubs representing >20% of total vegetation cover
Herbaceous:
~ 71: grassland with herbaceous vegetation representing >80% of total vegetation cover
Planted/Cultivated:
~ 81: cultivated pasture with herbaceous pasture/hay representing >20% of total vegetation cover
~ 82: cultivated cropland with crop vegetation representing >20% of total vegetation cover
Wetlands:
~ 90: woody wetlands where tree or shrub cover accounts for >20% of total vegetation cover
~ 95: herbaceous wetlands where herbaceous vegetation accounts for >80% of total vegetation cover
Overall, 49% (23 km2) of the watershed was classified as plantable space (Figure ES.4). The land cover class with the most plantable space was open developed land (NLCD code 21), containing 40% (9 km2) of total watershed plantable space. The group of land cover types described as “developed” (NLCD code(s) 21, 22, 23, 24) accounted for the majority of total plantable space (95%, or 22 km2) while accounting for 93% (44 km2) of the watershed area. The land cover class with the largest proportion of its land area as plantable space was cultivated pasture (NLCD code 81, 80% plantable).
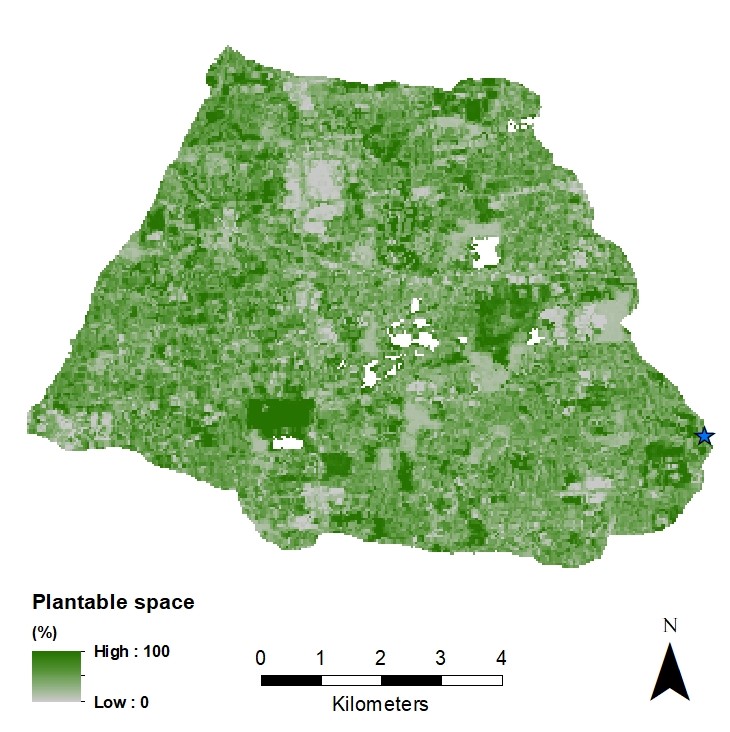
Figure ES.4: Spatial distribution of plantable space in the Plum Brook watershed. Blue star indicates the watershed drainage point.
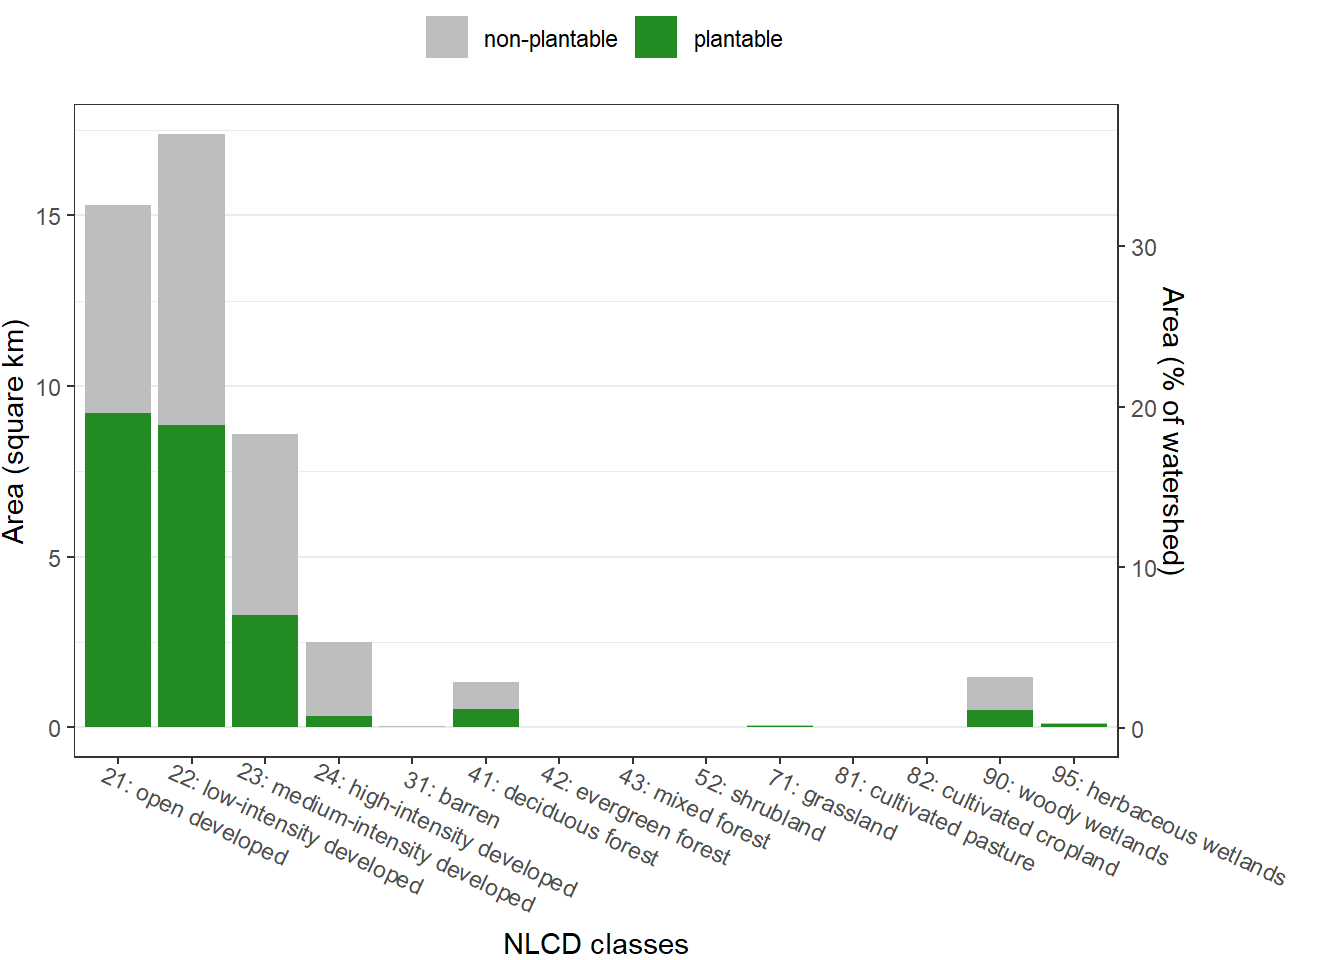
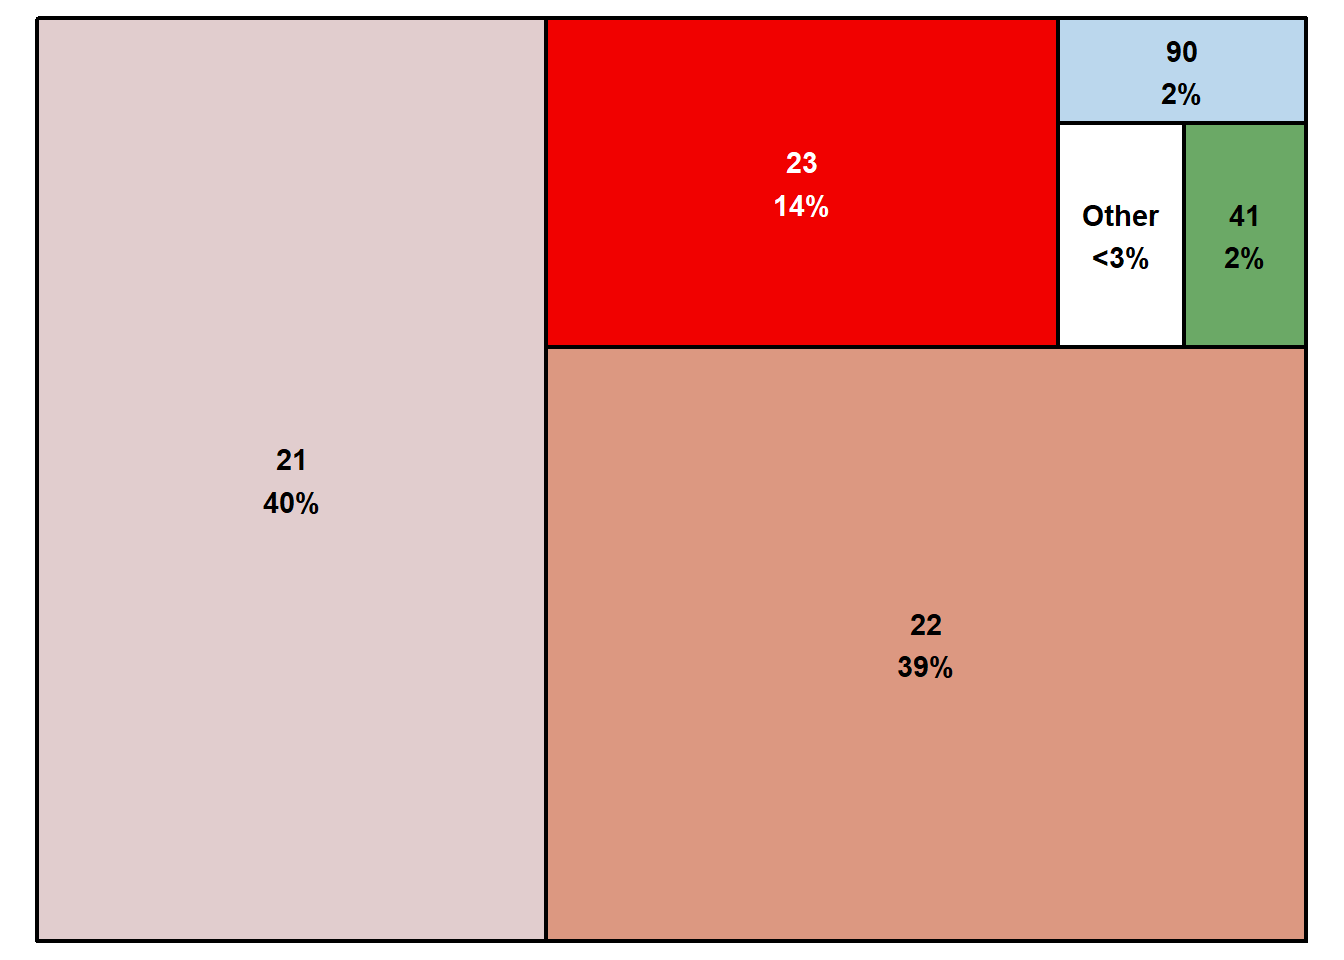
Figure ES.5. Plantable space (PS) information for each non-water land cover class in the watershed: (top) total area and PS, in km2 and as percent of total watershed space; (bottom) distribution of PS between land covers.
Recommendations
Plantable space varies across the watershed, even within a single land cover class. Maps of plantable areas such as Figure ES.4 can be used to target locations in the watershed with the greatest potential to enhance tree canopy. Verification of plantable space can be done through site visits, or by analyzing recent aerial images via i-Tree Landscape or other programs with aerial imagery (e.g., Google Earth, Google Maps).
On their own, plantable space data describes where increasing tree canopy is possible. Comparing plantable space data with datasets of other valuable watershed characteristics can help determine where increasing tree canopy could be most effective or useful. The dataset(s) used for comparison will depend on the priorities of each management plan. For example, detailed watershed locations where trees reduce runoff and nutrient loading are given in the i-Tree Buffer analysis (Chapter 2). The maps of plantable space, NLCD cover, and nutrient loading (along with other datasets) can be downloaded at the GLRI Forest Planning project webpage for further visualization and analysis.
Chapter 4: Tree Species Recommendations
Methods
The i-Tree Species tool was used to generate a list of recommended tree species best suited to reduce storm water runoff. This tool ranks tree species based on potential benefits derived from a tree at maturity. For this assessment, the tool ranked tree species based only on their potential to reduce runoff. The top 10% of species that grow within the watershed’s USDA hardiness zone (6) were compiled into the final list.
Results
Table ES.3. Top ten entries from the recommended list of species for the watershed. The list of the top 10% of species is provided in Chapter 4.| Scientific Name | Common Name | O3 | NO2 | SO2 | Pest Riskb |
|---|---|---|---|---|---|
| Liriodendron tulipifera | Tulip tree | S | |||
| Ulmus americana | American elm | I/S | ALB, DED, WM | ||
| Tilia americana | American basswood | I | I | GM, WM | |
| Ulmus glabra | Wych elm | ALB, DED | |||
| Betula alleghaniensis | Yellow birch | I | S | ALB, LAT, WM | |
| Magnolia acuminata | Cucumber tree | ||||
| Liriodendron chinense | Chinese tulip tree | ||||
| Magnolia officinalis | NCNc | ||||
| Tilia platyphyllos | Bigleaf linden | I | GM | ||
| Larix kaempferi | Japanese larch | I | S |
a Sensitivity: “S” indicates sensitive to pollutant; “I” indicates intermediate rating between sensitive and tolerant to pollutant; and “S/I” indicates a mix of sensitive and intermediate ratings in the literature. O3 = ozone; NO2 = nitrogen dioxide; SO2 = sulfur dioxide.
b Pest abbreviations: ALB - Asian longhorned beetle; DED - Dutch elm disease; WM - winter moth; GM - gypsy moth; LAT - large aspen tortrix
c NCN: no common name
Recommendations
All healthy trees have the potential to reduce storm water runoff by intercepting rainfall and transpiring water, but larger trees with more leaf area tend to provide more of these services than smaller tree species. As the recommended list is only based on USDA hardiness zone and estimated benefits, local expert knowledge on tree species suitability to an area is essential to refine this list.
Land managers making species selections should consider choices that will enhance the local diversity of urban forests. Increasing species diversity in forest ecosystems increases the likelihood trees will survive being exposed to pests (Guo et al., 2019) and disease (Haas et al., 2011). Species selections should also ensure that the tree can survive under the local conditions and remain healthy throughout its potential life span. Longer-lived species have the potential to provide greater benefits through time. Species recommendations are based on the size of tree at maturity and do not consider species life span.